TACGenomics is a genomic service company based in California USA, providing comprehensive solution to the problem of handling data generated by NGS devices.
- 1-(424)-361-5063
- service@tacgenomics.com
- 425 Broadway, Santa Monica, CA 90401 USA
Whole exome sequencing has extensive application including rare variant detection of complex disorders, genetic discovery of mendelian disorders and clinical diagnostics. Our team has successfully discovered a causal variant which lead to a mendelian disorder through analyzing 20 samples in three-generation family. The error rate of genotype we called in this family is only 0.2% which indicate that our pipeline detect all the SNV very accurately..
For your project, we will give a detailed QC report of data from raw fastq file to aligned BAM file and also data visualization of your result. Below figures are some examples from our sample project:
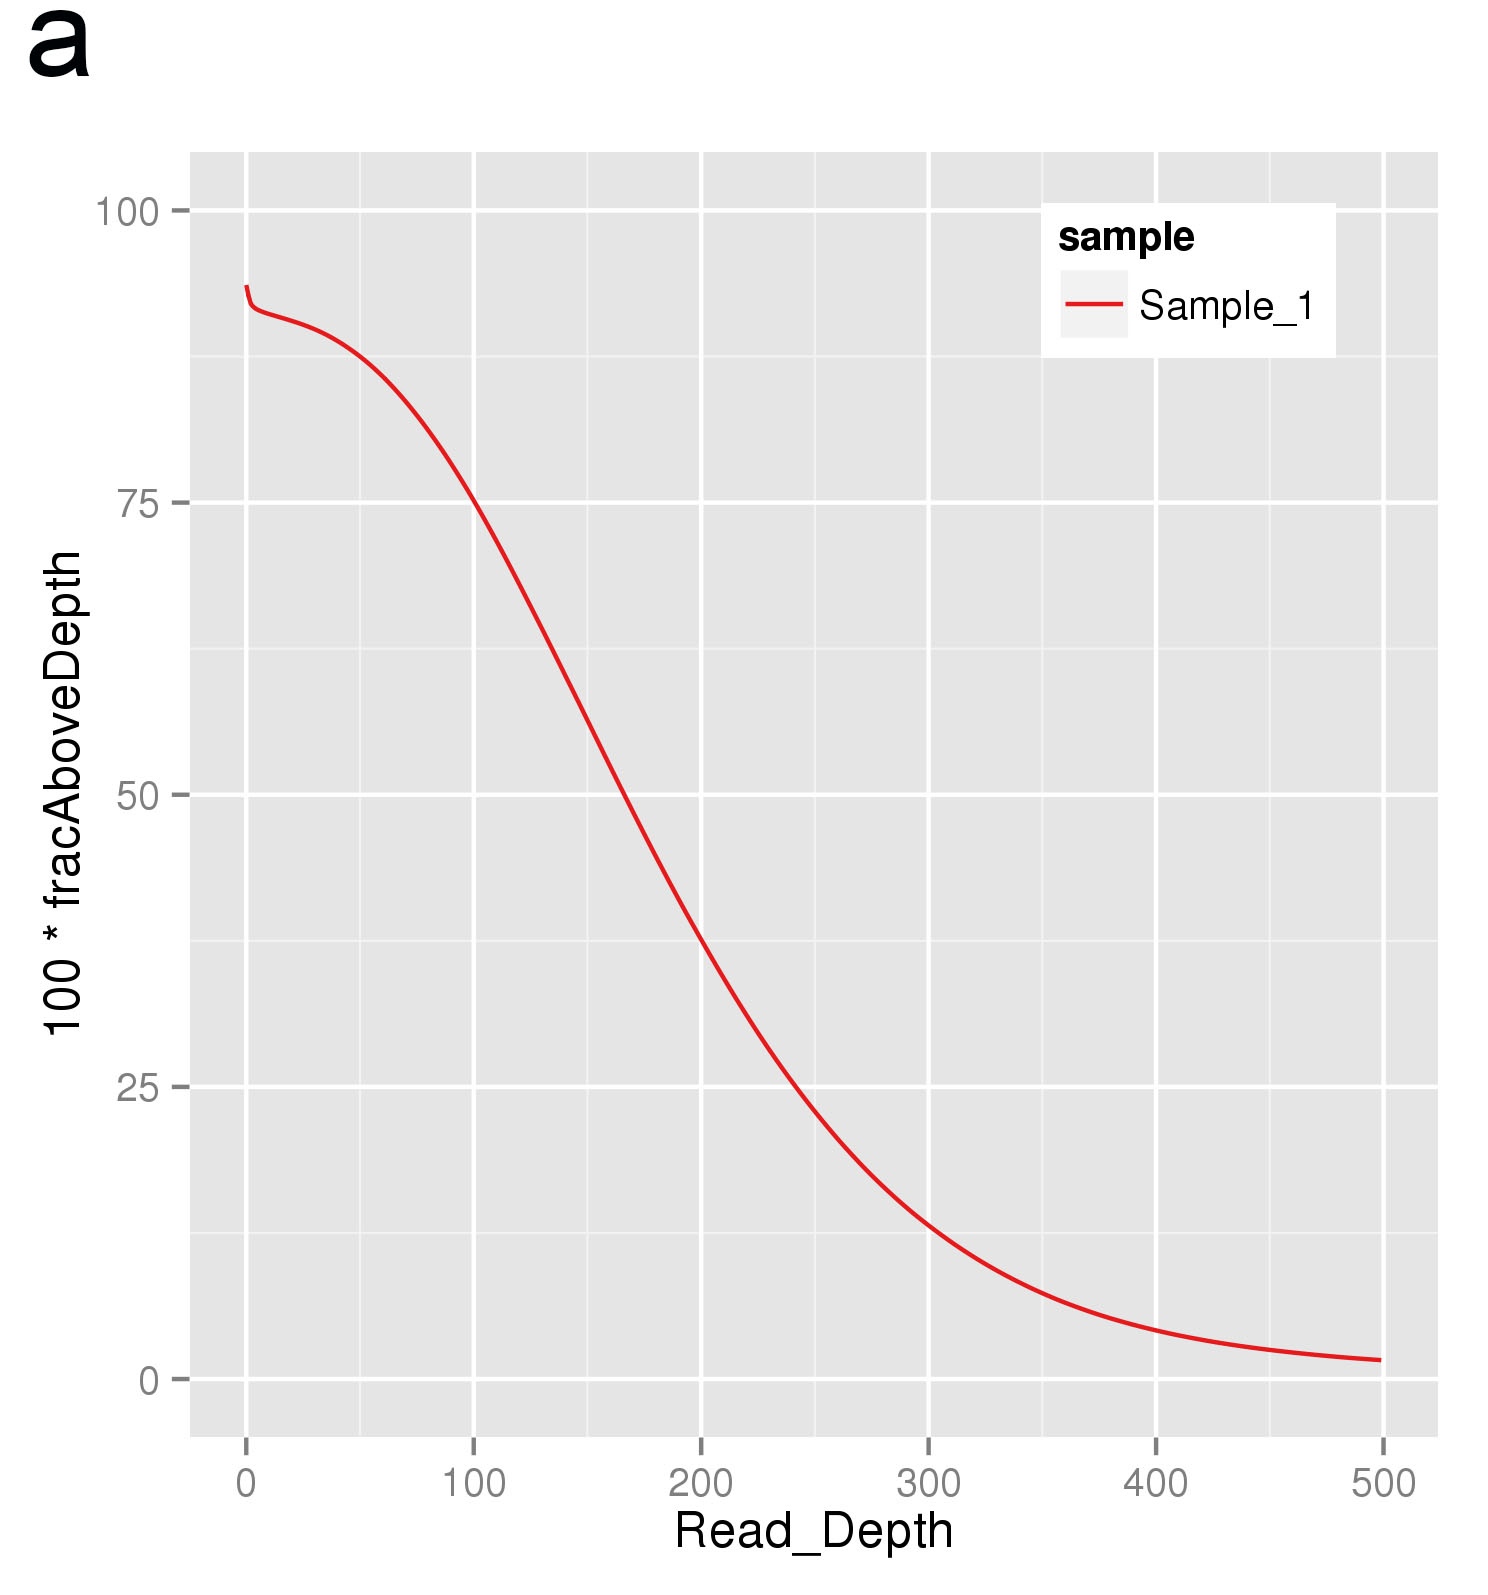
a. Plot of exome coverage. The exome coverage is the key quality control of the exome seq project. An average coverage of 50 is required for germline SNV calling and an average coverage of 80 is required for somatic SNV calling. In the figure, x-axis is the read depth and y-axis is the percentage of the target region whose depth was more than the depth in x-axis. The average coverage in this plot is around 120.
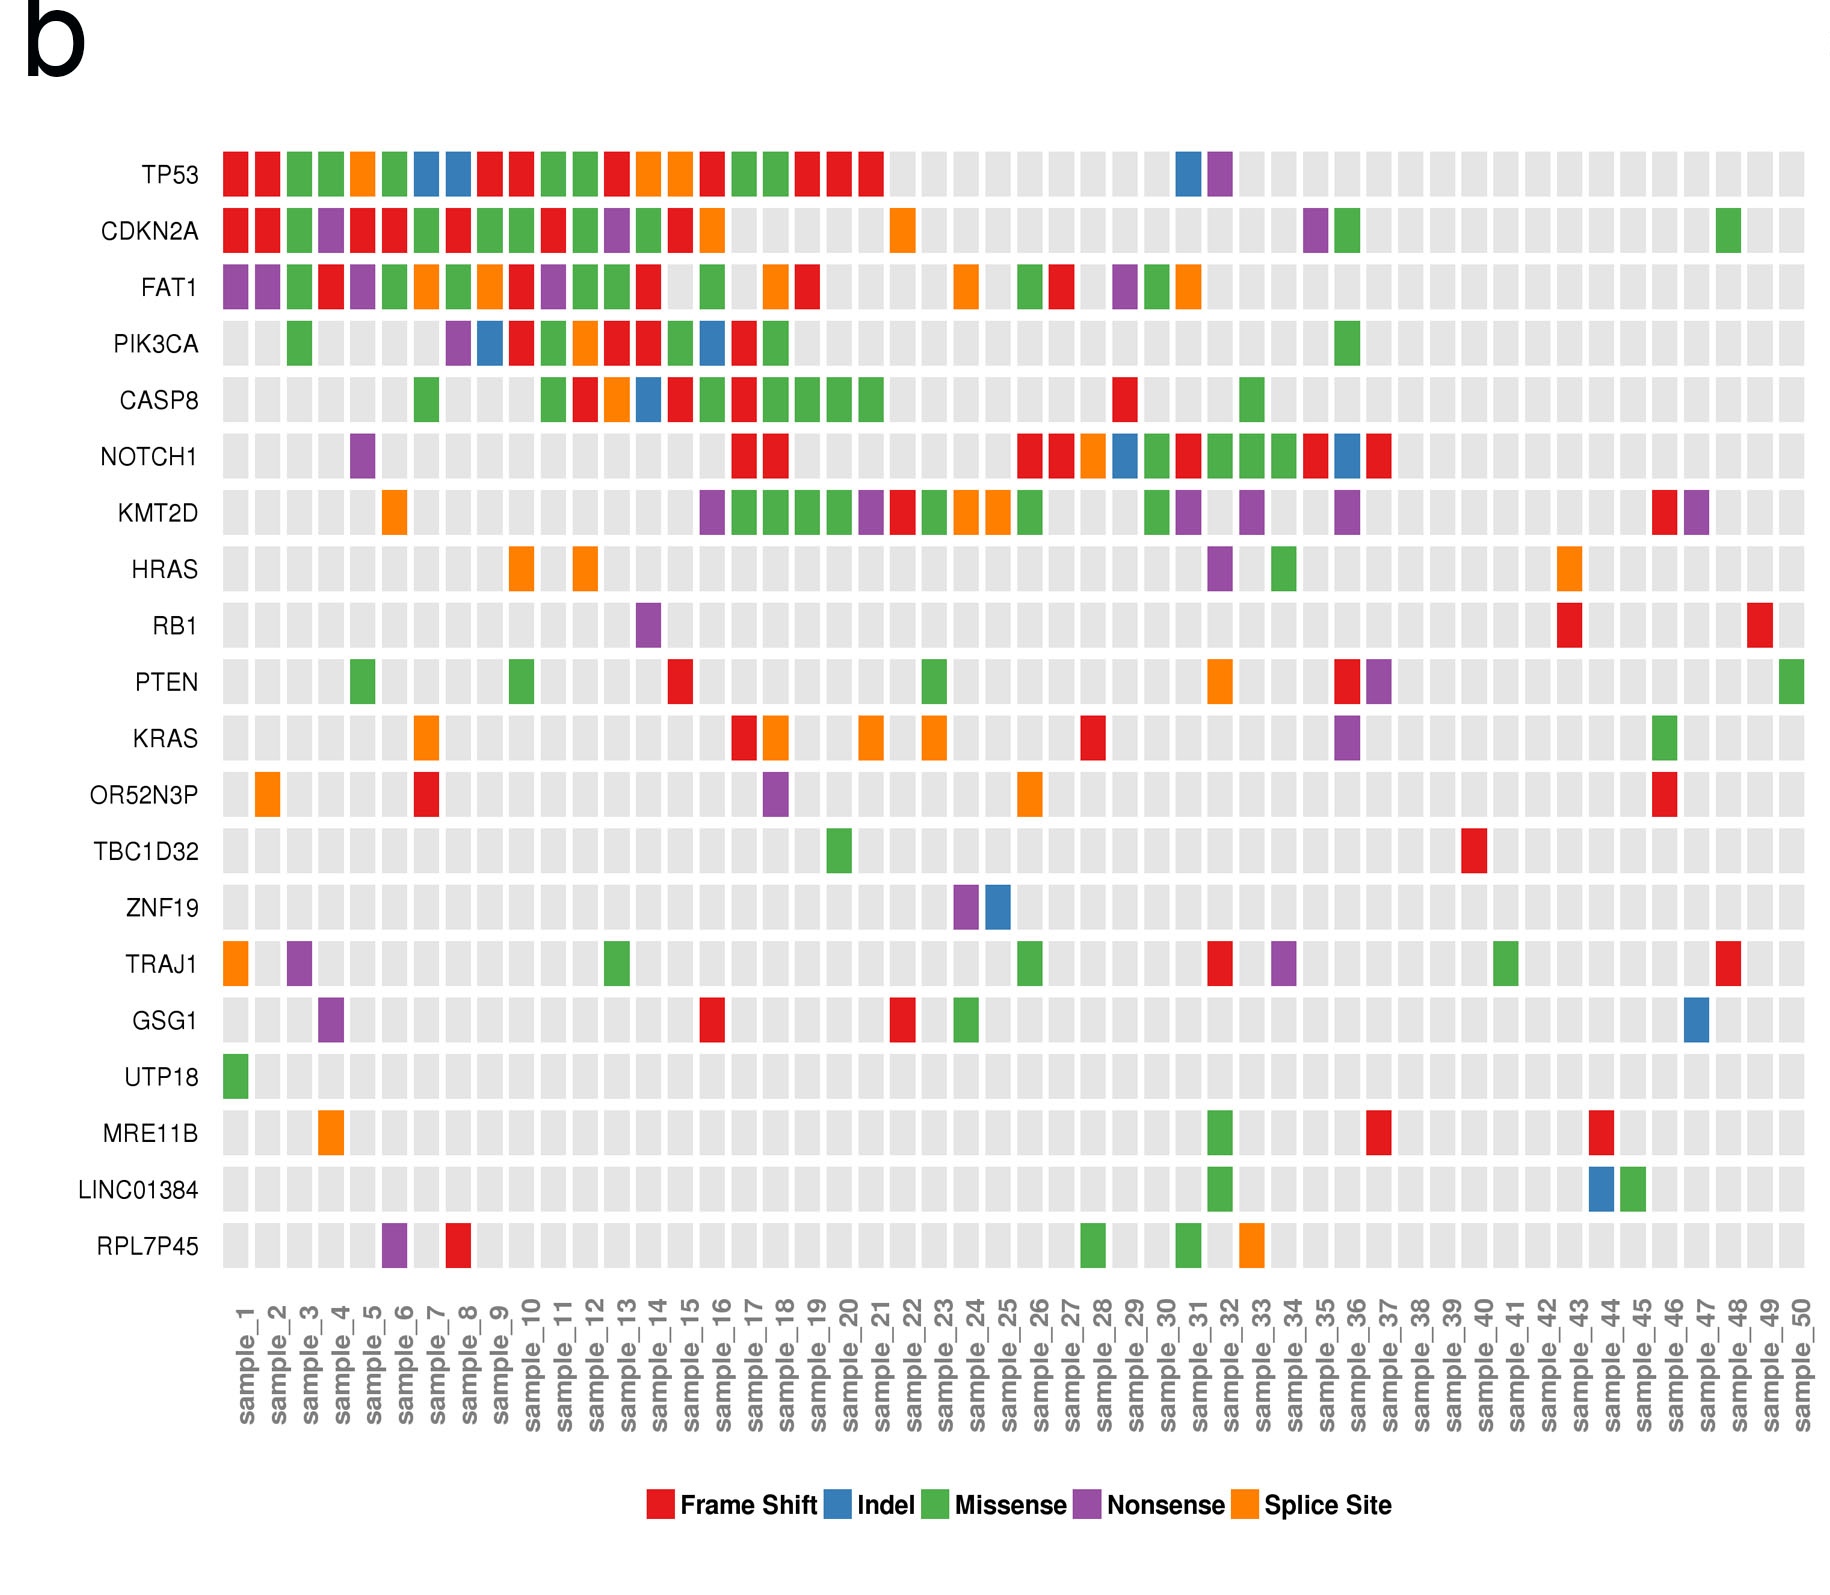
b. Plot of coMut. CoMut plot is widely used in the exome seq of large samples particularly in cancer field. In the coMut plot, each column shows information for a single, anonymous patient’s tumor, and each row reveals a specific gene’s alterations in different patients. Our example showed the mutation of most frequently mutated 20 genes in 50 patients.
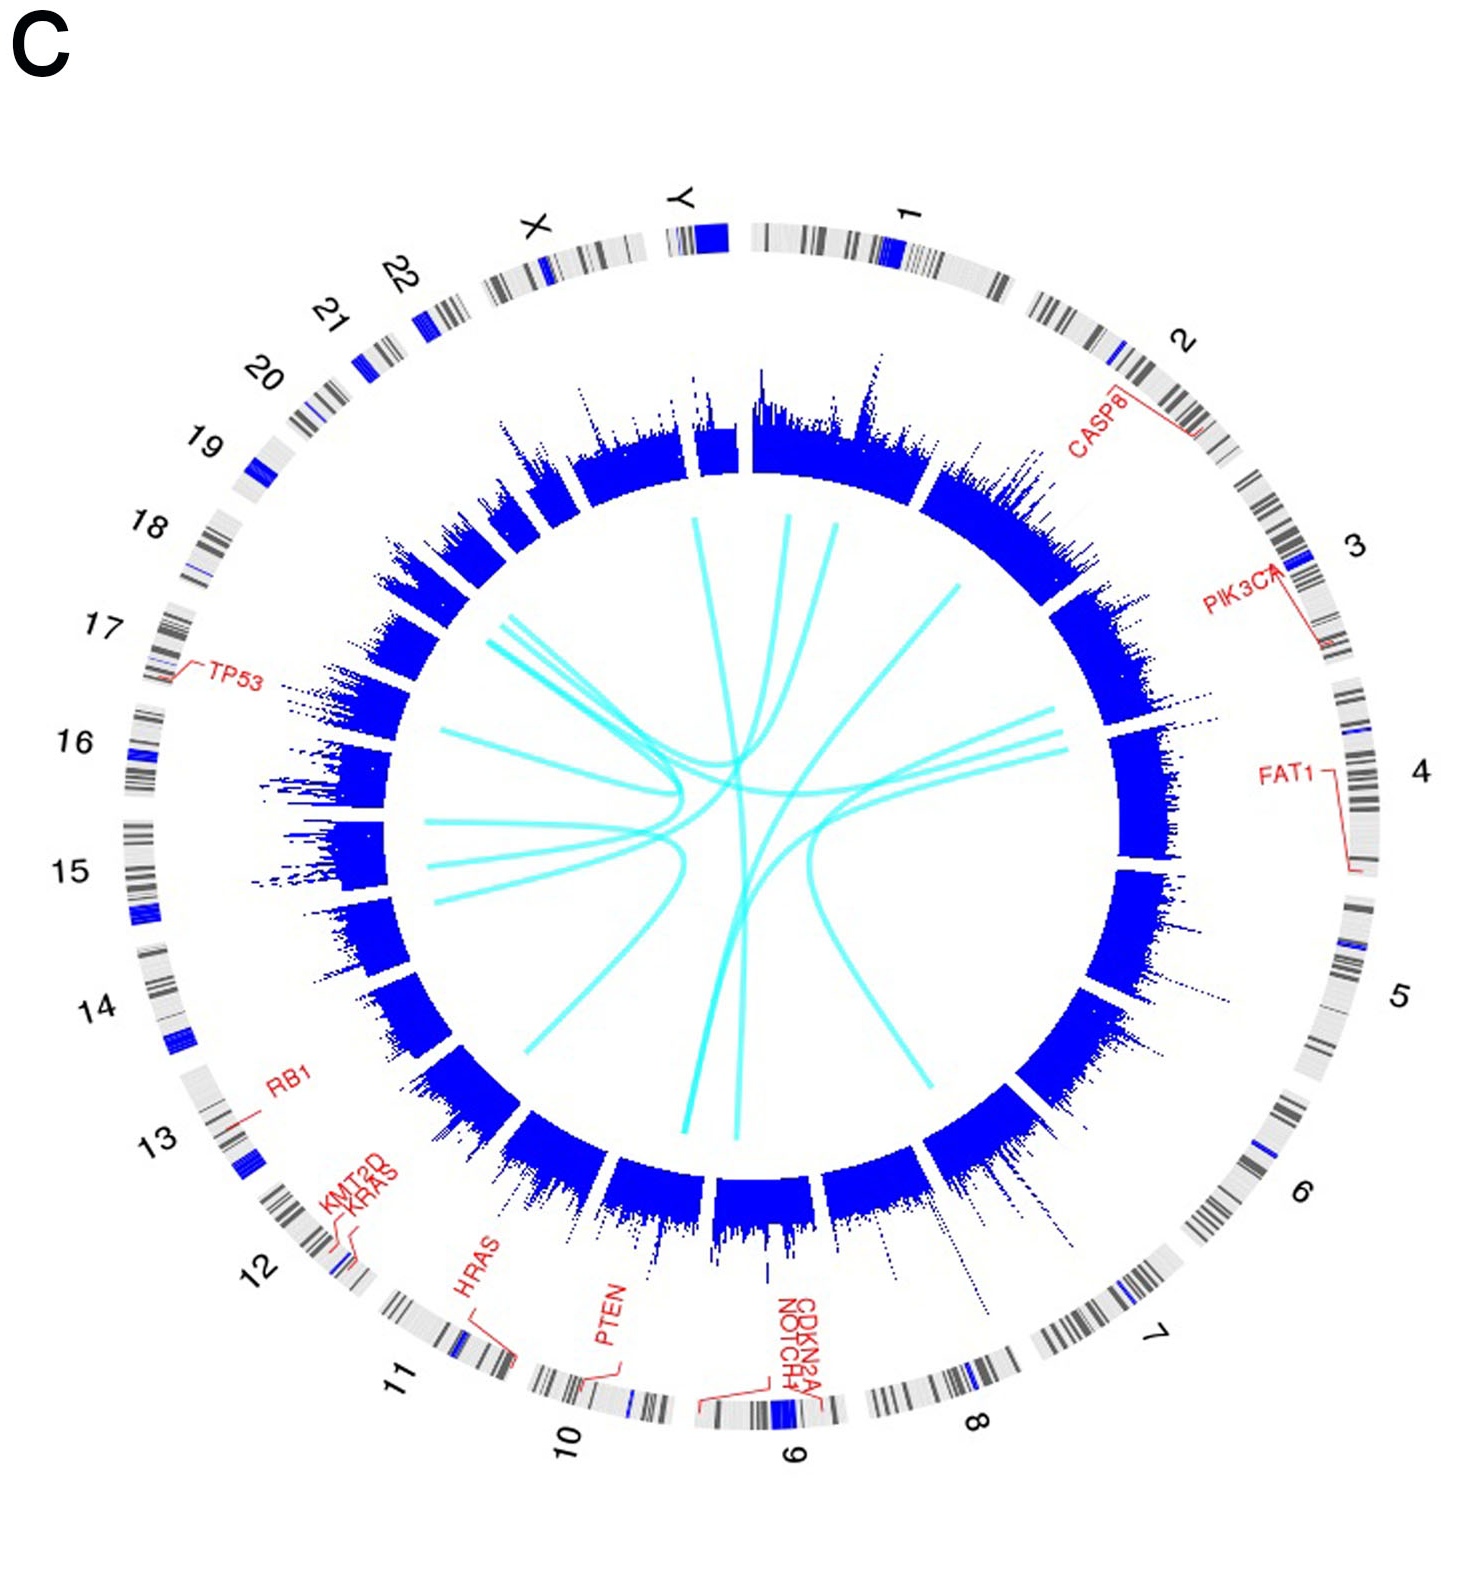
c. Plot of circos. The track one is the most frequently mutated genes form b, the track two is the exome coverage in the genome scale and track three is the structural variation from whole genome sequencing.
TACGenomics is a genomic service company based in California USA, providing comprehensive solution to the problem of handling data generated by NGS devices.