TACGenomics is a genomic service company based in California USA, providing comprehensive solution to the problem of handling data generated by NGS devices.

- 1 Quality Control of the Data
- 1.1 Quality Control of Raw Fastq Data
- 1.2 Quality Control of Mapping Statistics Data
- 1.3 Quality Control of Coverage Data
- 1.4 Quality Control of Sample PCA Data
- 2 Analyzed Result
- 2.1 Normalized Gene Expression Data
- 2.2 Differential Gene Expression Data
- 2.3 Analyzed GO and Pathway Data
- 2.3.1 GO Enrichment Analysis
- 2.3.2 KEGG Pathway Enrichment Analysis
- 2.3.3 Reactome Pathway Enrichment Analysis
- 3 Methods Description
- 4 Reference
RNAseq Data Analysis Report
1 Quality Control of the Data
1.1 Quality Control of Raw Fastq Data
1.1 Quality Control of Raw Fastq Data
Fastqc software was used to check the data qulaity of original sequencing data.Fastqc report was saved in 01report_of_fastq_data_quality:
QC evaluation of fastq data
| Filename | Total_Sequences | Sequence_Length | GC_Percentage | QC_Detail |
|---|---|---|---|---|
| Cancer1_R1.fastq.gz | 42388539 | 50-150 | 47 | See detail |
| Cancer1_R2.fastq.gz | 42388539 | 50-150 | 47 | See detail |
| Cancer2_R1.fastq.gz | 42641519 | 50-150 | 48 | See detail |
| Cancer2_R2.fastq.gz | 42641519 | 50-150 | 49 | See detail |
| Cancer3_R1.fastq.gz | 41688137 | 50-150 | 49 | See detail |
| Cancer3_R2.fastq.gz | 41688137 | 50-150 | 50 | See detail |
| Normal1_R1.fastq.gz | 41361293 | 50-150 | 47 | See detail |
| Normal1_R2.fastq.gz | 41361293 | 50-150 | 47 | See detail |
| Normal2_R1.fastq.gz | 37607001 | 50-150 | 49 | See detail |
| Normal2_R2.fastq.gz | 37607001 | 50-150 | 49 | See detail |
1.2 Quality Control of Mapping Statistics Data
The main purpose of mapping QC is to check the reads distribution in rRNA,exon,intron and intergenic regions in addition to the overall mapping rate.Data was saved in 02report_of_alignment_statistics:
QC evaluation of mapping data
| Sample | Total_Reads | Mapped_Reads | Ribsome_Reads | Coding_Reads | UTR_Reads | Intronic_Reads | Intergenic_Reads |
|---|---|---|---|---|---|---|---|
| Normal1 | 41361293 | 38781291 (93.76%) | 25022 (0.07%) | 22138959 (57.58%) | 8466157 (22.02%) | 5039534 (13.11%) | 2780231 (7.23%) |
| Cancer1 | 42388539 | 39161503 (92.38%) | 12164 (0.03%) | 20214771 (52.14%) | 9806043 (25.29%) | 5109707 (13.18%) | 3630304 (9.36%) |
| Normal2 | 37607001 | 34450687 (91.60%) | 19065 (0.06%) | 18123292 (52.84%) | 6920256 (20.18%) | 4284096 (12.49%) | 4953391 (14.44%) |
| Cancer2 | 42641519 | 38221687 (89.63%) | 12040 (0.03%) | 17632951 (46.28%) | 9837193 (25.82%) | 5402288 (14.18%) | 5214043 (13.69%) |
| Normal3 | 36343292 | 32878384 (90.46%) | 6094 (0.02%) | 18289264 (55.85%) | 7133801 (21.79%) | 3162628 (9.66%) | 4153693 (12.68%) |
| Cancer3 | 41688137 | 38190233 (91.60%) | 13258 (0.03%) | 20601686 (54.19%) | 10154672 (26.71%) | 3348380 (8.81%) | 3897945 (10.25%) |
Note: For a good quality mapping data, the overall mapping rate should be more than 80% and rRNA percentage is less than 5%. If the intergenic percentag is more than 50%, there may be some gDNA contamination.
1.3 Quality Control of Coverage Data
The purpose of coverage QC is to check whether the coverage is even in gene body region. 3’terminal bias indicates the degradation of RNA. Only two samples data were shown here. All data was saved in 03report_of_genebody_coverage:
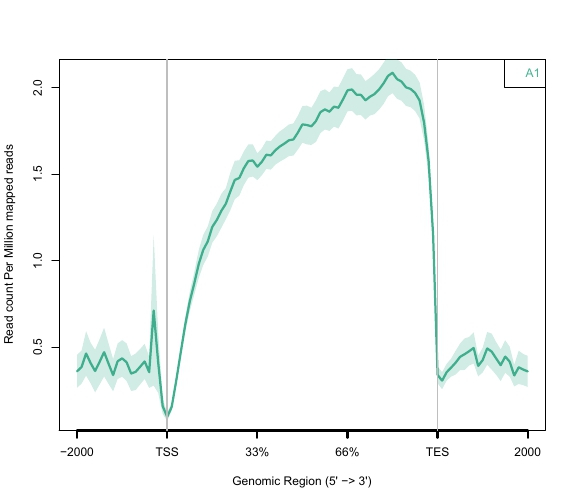
Cancer1 Gene Body Coverage Plot

Cancer2 Gene Body Coverage Plot
1.4 Quality Control of Sample PCA Data
PCA was used to check the samples cluster within group and between groups. Outliers can be identified based on PCA information.Data was saved in 04report_of_gene_expression_analysis:
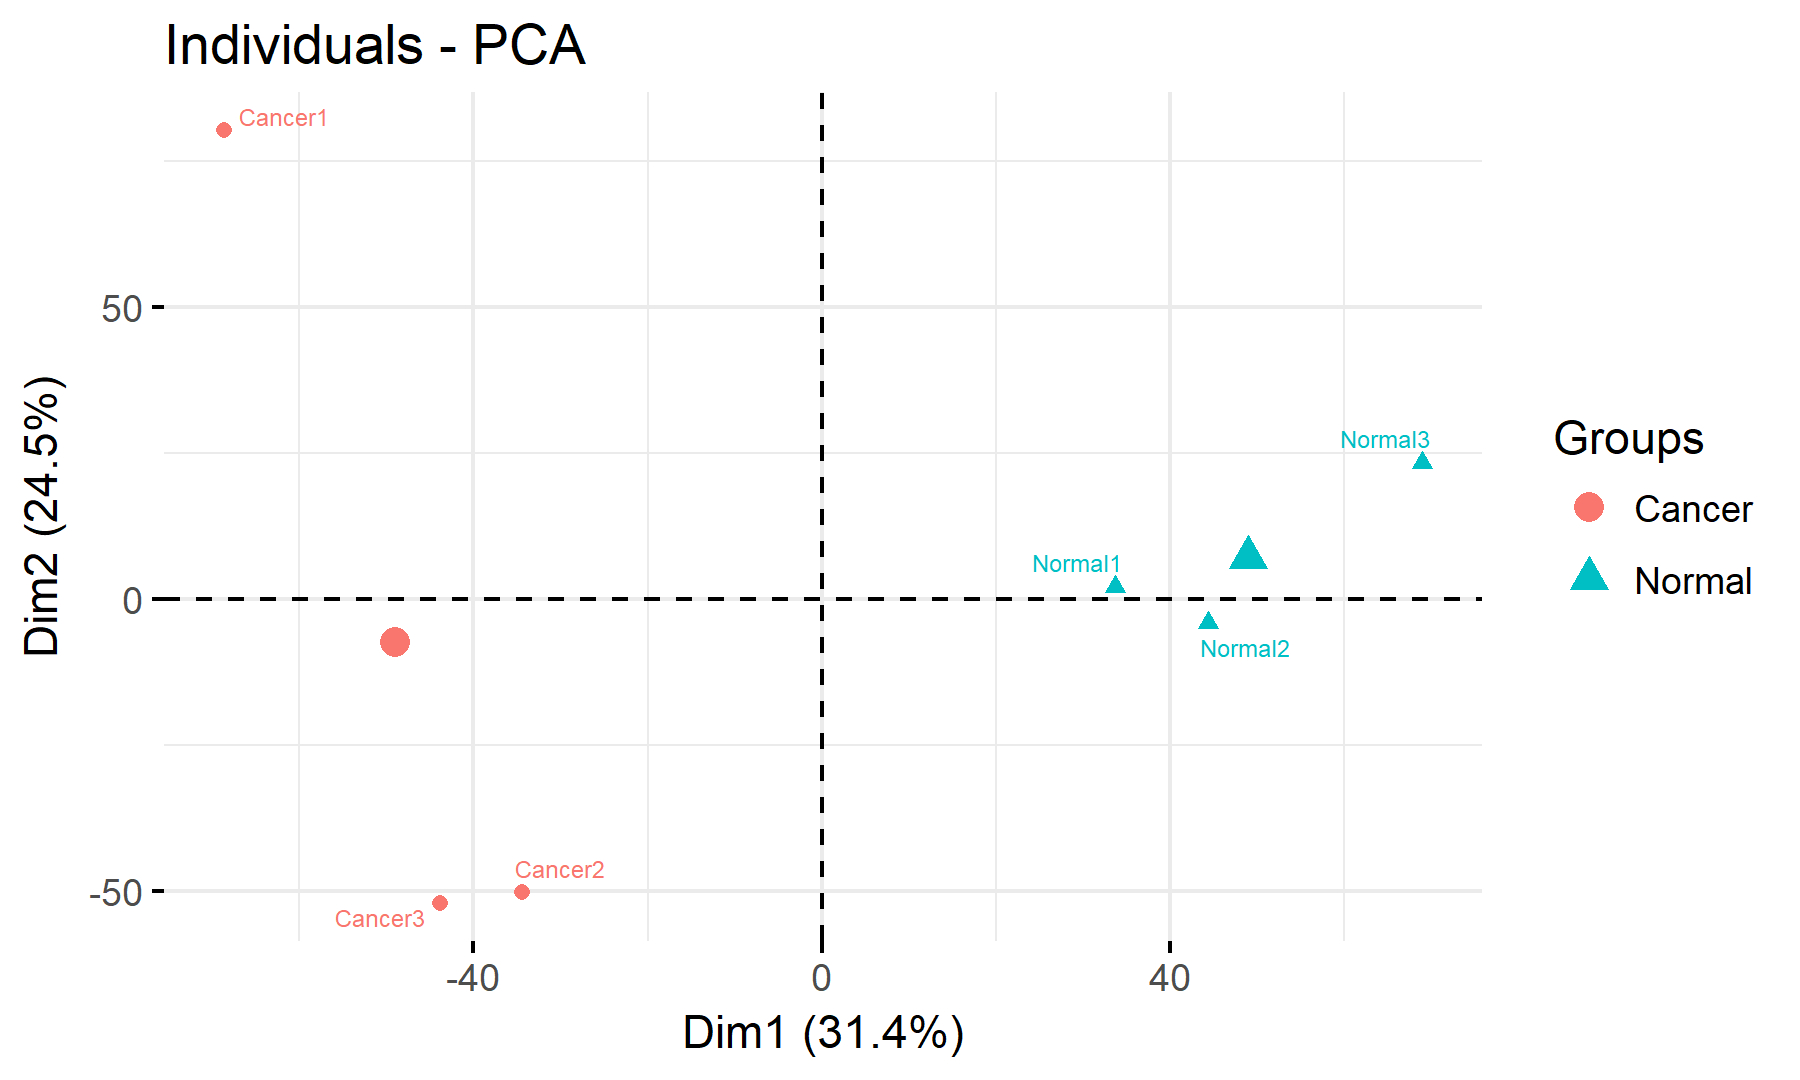
PCA Plot
2 Analyzed Result
2.1 Normalized Gene Expression Data
TMM (trimmed mean of M-values) method in edgeR package was used to normalize the gene expression.Data was saved in 04report_of_gene_expression_analysis:
TMM normalized gene expression data
| Gene_symbol | NAME | Cancer1 | Cancer2 | Cancer3 | Normal1 | Normal2 | Normal3 |
|---|---|---|---|---|---|---|---|
| A1BG | alpha-1-B glycoprotein | 131.205 | 61.253 | 852.089 | 856.024 | 968.001 | 892.122 |
| A1BG-AS1 | A1BG antisense RNA 1 | 1.995 | 1.124 | 3.404 | 1.670 | 2.528 | 3.062 |
| A1CF | APOBEC1 complementation factor | 777.165 | 228.392 | 702.826 | 759.908 | 755.408 | 1278.096 |
| A2M | alpha-2-macroglobulin | 1082.644 | 635.069 | 3665.401 | 8478.250 | 9713.626 | 9161.569 |
| A2M-AS1 | A2M antisense RNA 1 (head to head) | 1.848 | 1.760 | 2.618 | 3.898 | 8.028 | 7.931 |
| A2ML1 | alpha-2-macroglobulin-like 1 | 0.000 | 0.073 | 0.029 | 0.000 | 0.089 | 0.100 |
| A2MP1 | alpha-2-macroglobulin pseudogene 1 | 0.029 | 0.147 | 0.058 | 0.139 | 0.310 | 0.000 |
| A3GALT2 | alpha 1,3-galactosyltransferase 2 | 0.000 | 0.000 | 0.000 | 0.000 | 0.089 | 0.050 |
| A4GALT | alpha 1,4-galactosyltransferase | 0.528 | 3.569 | 1.542 | 4.454 | 2.262 | 2.460 |
| A4GNT | alpha-1,4-N-acetylglucosaminyltransferase | 0.000 | 1.198 | 0.407 | 0.278 | 0.044 | 0.151 |
2.2 Differential Gene Expression Data
EdgeR was used to perform the differential gene analysis and the cutoff is p<0.05 and foldcahnge >1.5. Only one comparison data was shown here. All data was saved in 04report_of_gene_expression_analysis:
CancervsNormal differential gene expression data
| Gene_symbol | NAME | Foldchange | PValue | FDR | Cancer1 | Cancer2 | Cancer3 | Normal1 | Normal2 | Normal3 |
|---|---|---|---|---|---|---|---|---|---|---|
| A2M | alpha-2-macroglobulin | -5.185 | 0.007 | 0.068 | 1075.741 | 640.041 | 3612.968 | 8485.054 | 9782.632 | 9363.327 |
| A2M-AS1 | A2M antisense RNA 1 (head to head) | -3.239 | 0.014 | 0.111 | 1.837 | 1.774 | 2.581 | 3.901 | 8.085 | 8.106 |
| AACS | acetoacetyl-CoA synthetase | 3.165 | 0.005 | 0.053 | 19.998 | 14.091 | 14.022 | 7.592 | 3.931 | 3.643 |
| AADAC | arylacetamide deacetylase | -2.980 | 0.004 | 0.042 | 73.055 | 94.644 | 166.397 | 373.973 | 271.236 | 350.353 |
| AADACP1 | arylacetamide deacetylase pseudogene 1 | -2.984 | 0.038 | 0.213 | 2.216 | 4.828 | 1.348 | 3.587 | 7.058 | 14.468 |
| AADAT | aminoadipate aminotransferase | -9.155 | 0.000 | 0.000 | 6.384 | 8.967 | 2.437 | 30.508 | 45.295 | 87.268 |
| AASS | aminoadipate-semialdehyde synthase | -5.144 | 0.001 | 0.020 | 112.469 | 33.970 | 7.599 | 305.886 | 202.846 | 283.607 |
| AATK | apoptosis-associated tyrosine kinase | -3.563 | 0.012 | 0.100 | 0.787 | 0.961 | 0.602 | 1.881 | 4.333 | 2.206 |
| ABAT | 4-aminobutyrate aminotransferase | -6.354 | 0.000 | 0.004 | 286.623 | 58.259 | 79.026 | 908.673 | 704.669 | 1080.044 |
| ABCA8 | ATP-binding cassette, sub-family A (ABC1), member 8 | -8.943 | 0.000 | 0.000 | 22.243 | 14.707 | 4.359 | 120.188 | 85.588 | 163.761 |
Volcano plot shows significance versus fold-change on the y and x axes, respectively. The top 15 significant genes were labelled.

CancervsNormal Vocalno Plot
A heat map is a graphical representation of data where the individual values contained in a matrix are represented as colors. Red mean high expression and green mean low expression.

CancervsNormal Heatmap Plot
2.3 Analyzed GO and Pathway Data
2.3.1 GO Enrichment Analysis
Gene Ontology (GO) is an international standardized classification system for gene function, which supplies a set of controlled vocabulary to comprehensively describe the property of genes and gene products. There are 3 ontologies in GO: molecular function, cellular component and biological process. The main uses of the GO is to perform enrichment analysis on gene sets. For example, given a set of genes that are up-regulated and /or down-regulated under certain conditions, an enrichment analysis will find which GO terms are over-represented (or under-represented) using annotations for that gene set.Only one comparison data was shown here. GO analyzed data was saved in 05report_of_GO_Pathway_analysis:
Here N is the number of all genes with GO annotation,n is the number of target gene candidates in N,M is the number of all genes annotated to a certain pathway, and m is the number of target gene candidates in M.
CancervsNormal GO enrichment analysis data
| GO_ID | Description | GeneRatio | BgRatio | pvalue | p.adjust | qvalue | Count |
|---|---|---|---|---|---|---|---|
| GO:0016054 | organic acid catabolic process | 99/1743 | 213/16536 | 0 | 0 | 0 | 99 |
| GO:0046395 | carboxylic acid catabolic process | 99/1743 | 213/16536 | 0 | 0 | 0 | 99 |
| GO:0044282 | small molecule catabolic process | 114/1743 | 337/16536 | 0 | 0 | 0 | 114 |
| GO:1901565 | organonitrogen compound catabolic process | 106/1743 | 347/16536 | 0 | 0 | 0 | 106 |
| GO:0071103 | DNA conformation change | 84/1743 | 251/16536 | 0 | 0 | 0 | 84 |
| GO:0008202 | steroid metabolic process | 91/1743 | 287/16536 | 0 | 0 | 0 | 91 |
| GO:0006334 | nucleosome assembly | 56/1743 | 139/16536 | 0 | 0 | 0 | 56 |
| GO:0065004 | protein-DNA complex assembly | 67/1743 | 190/16536 | 0 | 0 | 0 | 67 |
| GO:0071466 | cellular response to xenobiotic stimulus | 63/1743 | 175/16536 | 0 | 0 | 0 | 63 |
| GO:0071824 | protein-DNA complex subunit organization | 71/1743 | 217/16536 | 0 | 0 | 0 | 71 |
- ID: the ID of the GO Term
- Description: the description of the GO Term
- GeneRatio: the denominator is the number of genes within that list which are annotated to the GO of interest and the numerator is the size of the list of genes of interest
- BgRatio: the denominator is the number of genes that are annotated to the GO of interest and the numerator is the total number of genes in the background distribution
- pvalue: P-value in hypergenometric test
- Count: The number of differential genes in this GO Term
GO enrichment bar plot shows most top 50 significant GO Terms.
CancervsNormal GO enrichment Plot
2.3.2 KEGG Pathway Enrichment Analysis
KEGG is a database resource for understanding high-level functions and utilities of the biological system, such as the cell, the organism and the ecosystem, from molecular-level information, especially large-scale molecular datasets generated by genome sequencing and other high-throughput experimental technologies. Pathway enrichment analysis identifies significantly enriched metabolic pathways or signal transduction pathways associated with differentially expressed genes compared with the whole genome background. Only one comparison data was shown here. The analyzed data was saved in 05report_of_GO_Pathway_analysis:
Here N is the number of all genes with KEGG annotation,n is the number of target gene candidates in N,M is the number of all genes annotated to a certain pathway, and m is the number of target gene candidates in M.
CancervsNormal KEGG Pathway enrichment analysis data
| PATH_ID | Description | GeneRatio | BgRatio | pvalue | p.adjust | qvalue | Count |
|---|---|---|---|---|---|---|---|
| hsa05322 | Systemic lupus erythematosus | 57/951 | 133/7469 | 0 | 0 | 0 | 57 |
| hsa00280 | Valine, leucine and isoleucine degradation | 30/951 | 48/7469 | 0 | 0 | 0 | 30 |
| hsa04610 | Complement and coagulation cascades | 36/951 | 79/7469 | 0 | 0 | 0 | 36 |
| hsa00071 | Fatty acid degradation | 25/951 | 44/7469 | 0 | 0 | 0 | 25 |
| hsa04110 | Cell cycle | 45/951 | 124/7469 | 0 | 0 | 0 | 45 |
| hsa05034 | Alcoholism | 57/951 | 180/7469 | 0 | 0 | 0 | 57 |
| hsa00260 | Glycine, serine and threonine metabolism | 22/951 | 40/7469 | 0 | 0 | 0 | 22 |
| hsa00380 | Tryptophan metabolism | 22/951 | 40/7469 | 0 | 0 | 0 | 22 |
| hsa01200 | Carbon metabolism | 41/951 | 116/7469 | 0 | 0 | 0 | 41 |
| hsa01212 | Fatty acid metabolism | 22/951 | 48/7469 | 0 | 0 | 0 | 22 |
CancervsNormal KEGG Pathway enrichment analysis data

CancervsNormal KEGG Pathway enrichment analysis data

CancervsNormal KEGG Pathway Bubble Plot
2.3.3 Reactome Pathway Enrichment Analysis
Reactome is an open source, open access, manually curated, peer-reviewed pathway database of human pathways and processes. The Reactome data model generalizes the concept of a reaction to include transformations of entities such as transport from one compartment to another and interaction to form a complex, as well as the chemical transformations of classical biochemistry. Entities include nucleic acids, small molecules, proteins (with or without post-translational modifications) and macromolecular complexes. Only one comparison data was shown here. The analyzed data was saved in 05report_of_GO_Pathway_analysis:x
CancervsNormal Reactome Pathway enrichment analysis data
| PATH_ID | Description | GeneRatio | BgRatio | pvalue | p.adjust | qvalue | Count |
|---|---|---|---|---|---|---|---|
| hsa05322 | Systemic lupus erythematosus | 57/951 | 133/7469 | 0 | 0 | 0 | 57 |
| hsa00280 | Valine, leucine and isoleucine degradation | 30/951 | 48/7469 | 0 | 0 | 0 | 30 |
| hsa04610 | Complement and coagulation cascades | 36/951 | 79/7469 | 0 | 0 | 0 | 36 |
| hsa00071 | Fatty acid degradation | 25/951 | 44/7469 | 0 | 0 | 0 | 25 |
| hsa04110 | Cell cycle | 45/951 | 124/7469 | 0 | 0 | 0 | 45 |
| hsa05034 | Alcoholism | 57/951 | 180/7469 | 0 | 0 | 0 | 57 |
| hsa00260 | Glycine, serine and threonine metabolism | 22/951 | 40/7469 | 0 | 0 | 0 | 22 |
| hsa00380 | Tryptophan metabolism | 22/951 | 40/7469 | 0 | 0 | 0 | 22 |
| hsa01200 | Carbon metabolism | 41/951 | 116/7469 | 0 | 0 | 0 | 41 |
| hsa01212 | Fatty acid metabolism | 22/951 | 48/7469 | 0 | 0 | 0 | 22 |
Reactome enrichment plots show most top 15 significant Reactome pathway.

CancervsNormal Reactome Pathway Bar Plot

CancervsNormal Reactome Pathway Bubble Plot
3 Methods Description
The reads were first mapped to the latest UCSC transcript set using Bowtie2 version 2.1.0 [1]and the gene expression level was estimated using RSEM v1.2.15.[2] Differentially expressed genes were identified using the edgeR program[3]. Genes showing altered expression with p < 0.05 and more than 1.5 fold changes were considered differentially expressed. Goseq[4] was used to perform the GO enrichment analysis and Kobas[5]was used to performed the pathway analysis.
4 Reference
[1] Langmead B et al., Fast gapped-read alignment with Bowtie 2, Nat Methods 9:357-9 (2012)
[2] Li B et al., RSEM: accurate transcript quantification from RNA-Seq data with or without a reference genome, BMC Bioinformatics 12:1-16 (2011)
[3] Robinson MD et al, edgeR: a Bioconductor package for differential expression analysis of digital gene expression data, Bioinformatics 26:139-140 (2010)
[4] Matthew DY et al., Gene ontology analysis for RNA-seq: accounting for selection bias, Genome Biology 11:R14 (2010)
[5] Chen X et al., KOBAS 2.0: a web server for annotation and identification of enriched pathways and diseases, Nucleic Acids Res 39:316-322 (2011)
Contact us
- 1-(424)-361-5063
- service@tacgenomics.com
- 425 Broadway, Santa Monica, CA 90401 USA
© 2023 TAC Genomics. All Rights Reserved. Developed By Digital Guider.