TACGenomics is a genomic service company based in California USA, providing comprehensive solution to the problem of handling data generated by NGS devices.
- 1-(424)-361-5063
- service@tacgenomics.com
- 425 Broadway, Santa Monica, CA 90401 USA
For your project, firstly we will give a detailed QC report of data from raw fastq file to aligned BAM file. Then we will run our cutting-edge pipeline indicated in our service page (scRNAseq pipeline ). Below figures are some examples from our sample project:
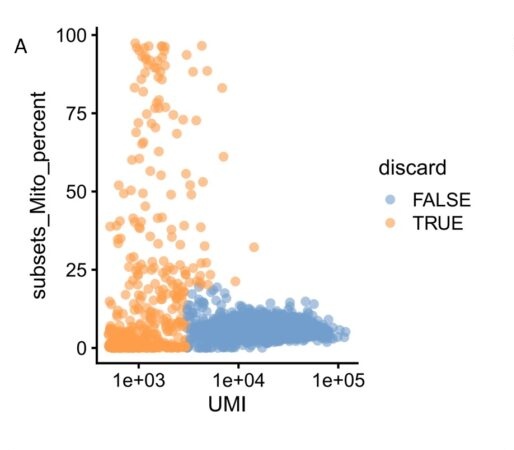
A. The low quality cells which has low UMI and/or high mito genes are removed before the downstream analysis.
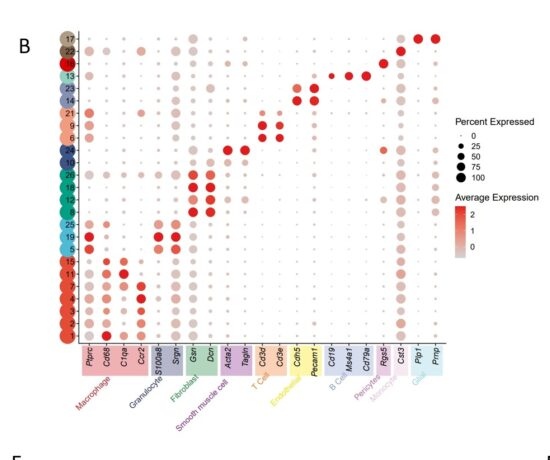
B. After the data normalization, clusters were identified using the findclusters function and marker genes were identified using findmarkers function. In the example data, 26 clusters were identified and assigned to 10 different cell types.
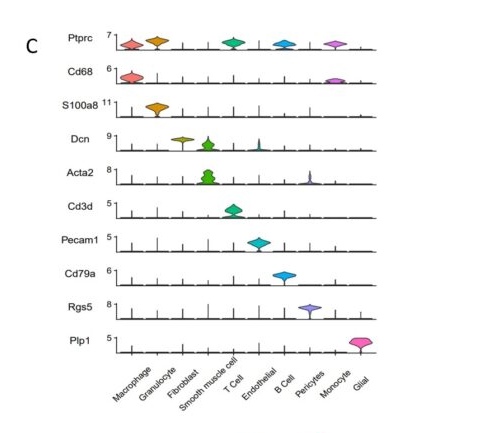
C. The violin plot was used to show the expression of marker genes in each cell type.
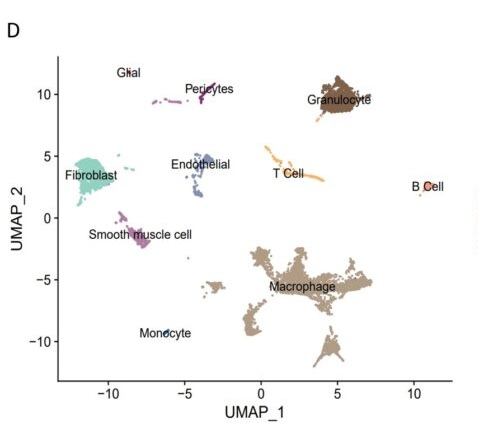
D. UMAP plot was used to show the cells colored by the cell types.
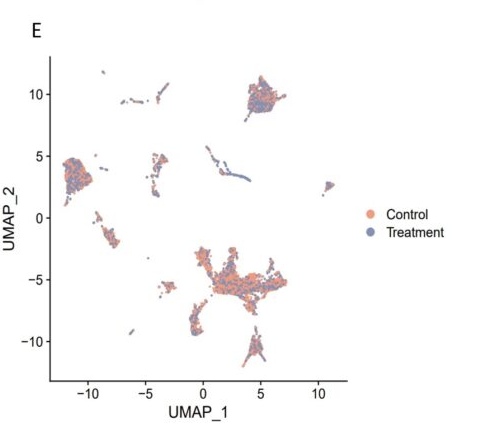
E. UMAP plot was used to show the cells colored by the samples.
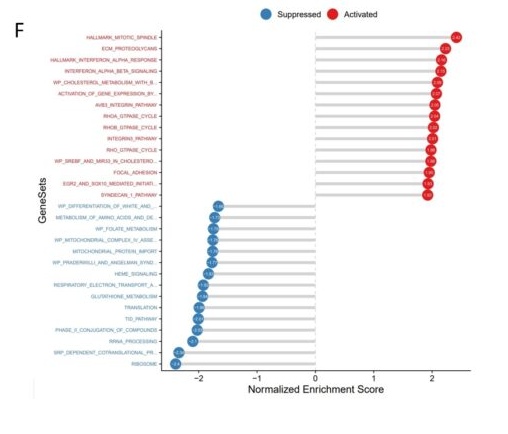
F. GSEA analysis of comparisons of same cell type between different samples. As shown in the fig, INTERFERON_ALPHA_RESPONSE was activated after treatment.
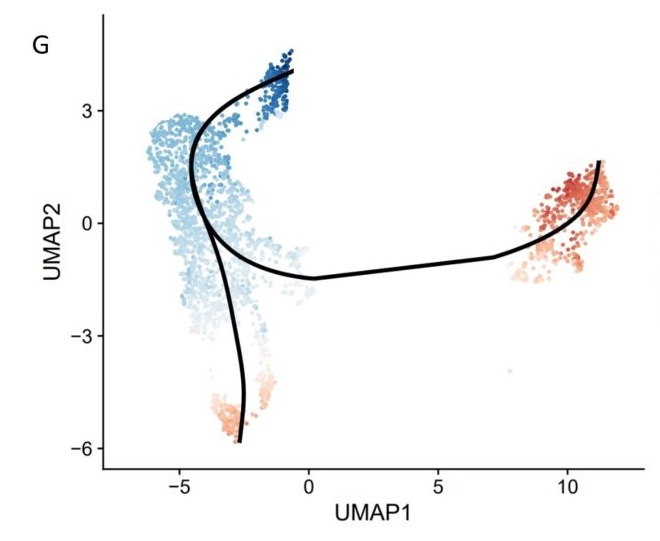
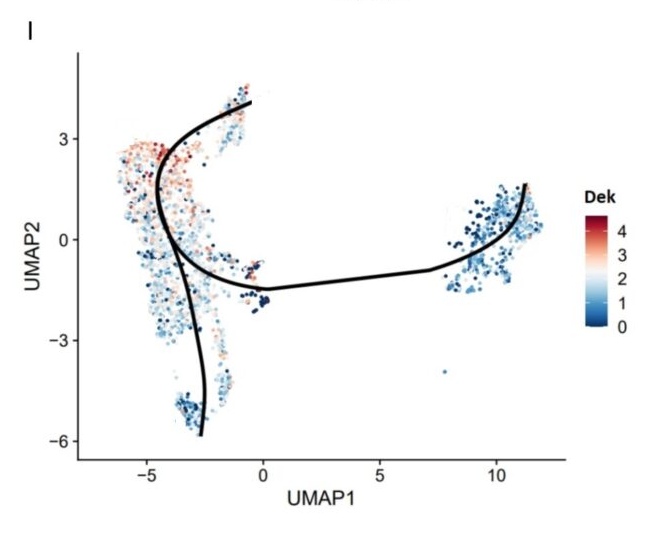
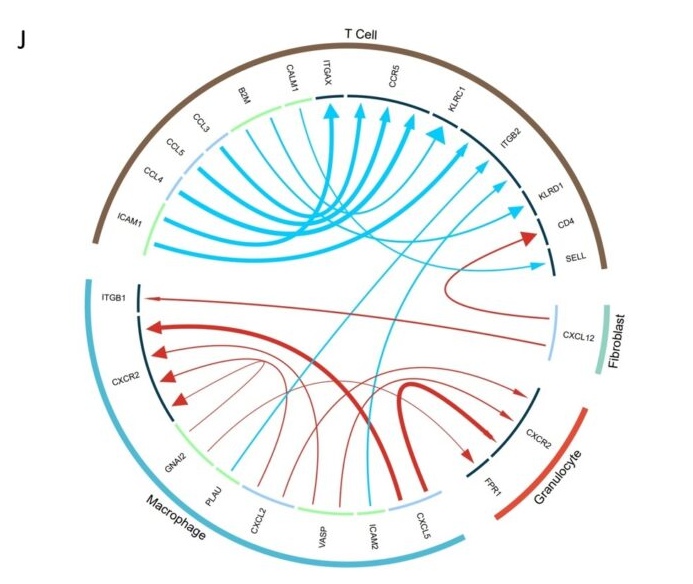
The trajectory analysis and cell communication analysis will be performed upon requested. Below figures are some examples from our sample project:
G. The trajectory analysis identified two lineages of this specific cell types.
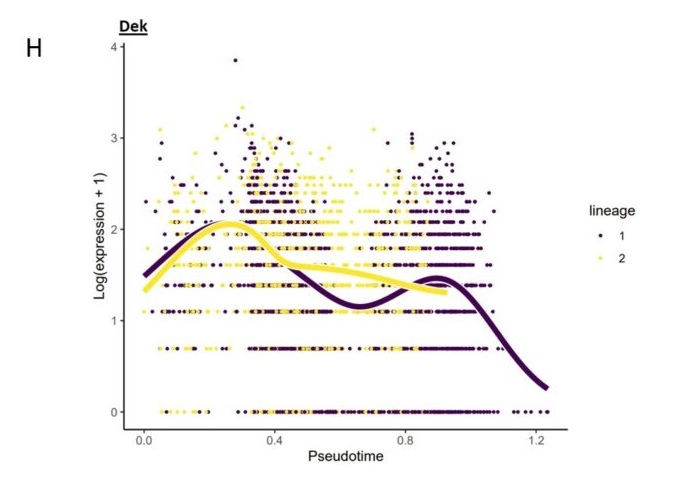
H. Correlation analysis showed the Dek expression was negatively correlated with pseudotime.
I. UMAP showed the expression of Dek in the cells.
J. Circos plots showed the interaction between different cell types.
TACGenomics is a genomic service company based in California USA, providing comprehensive solution to the problem of handling data generated by NGS devices.