TACGenomics is a genomic service company based in California USA, providing comprehensive solution to the problem of handling data generated by NGS devices.
- 1-(424)-361-5063
- service@tacgenomics.com
- 425 Broadway, Santa Monica, CA 90401 USA
ChIP-seq is a method which combines chromatin immunoprecipitation(ChIP) with massively parallel DNA sequencing to identify the binding sites of DNA-associated proteins.ChIP-seq is used primarily to determine how transcription factors and other chromatin-associated proteins influence phenotype-affecting mechanisms.
TACGenomics use the cutting-edge pipeline to analyze your Chip-seq data. We put more attention to quality control and data visualization.
.
For your project, we will give a detailed QC report of data from raw fastq file to aligned BAM file and also data visualization of your result. Below figures are some examples from our sample project:
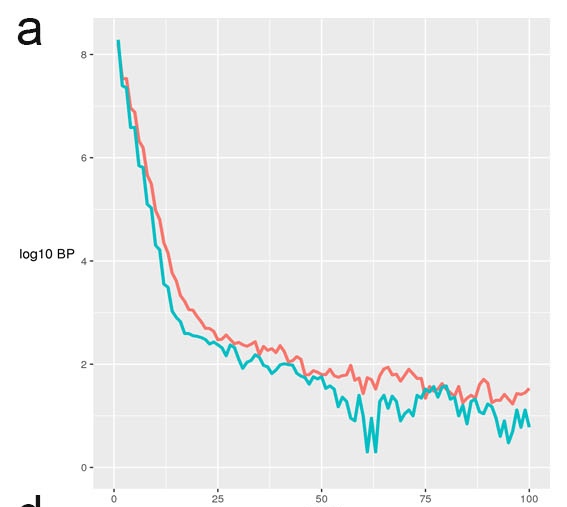
a. Plot of coverage histogram. This figure this plots the distribution of pileup values at each basepair. Enriched ChIP samples will tail off less quickly and show a higher proportion of genomic positions at greater depths. Other quality metrics of the enrichment including SSD, RiP% and RiBL will also be reported.
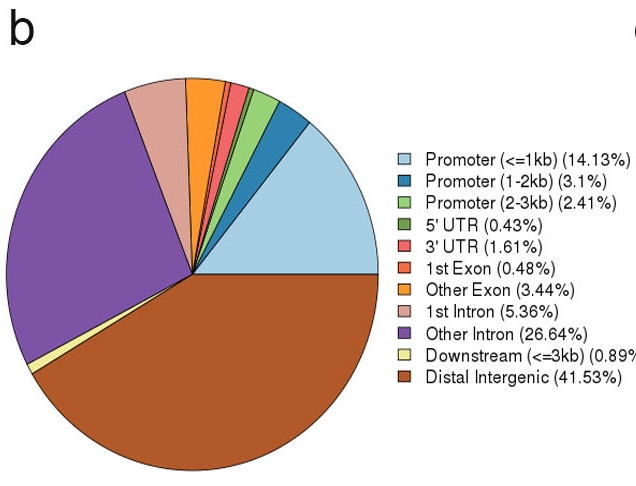
b. Plot of peak genomic annotation. This genomic annotation include the promoter, UTR, Exon, Intron and intergenic region.
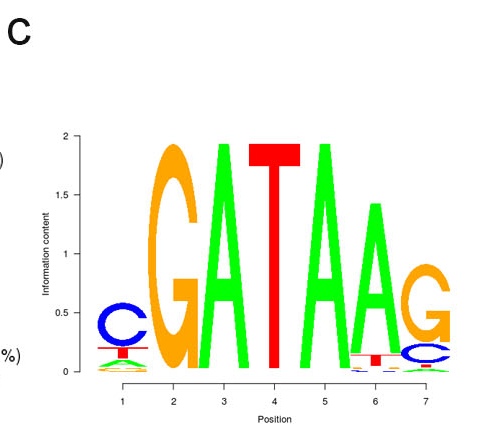
c. Plot of de novo motif. A Bayesian approach for motif discovery was used for de-novo discovery of enriched motifs.
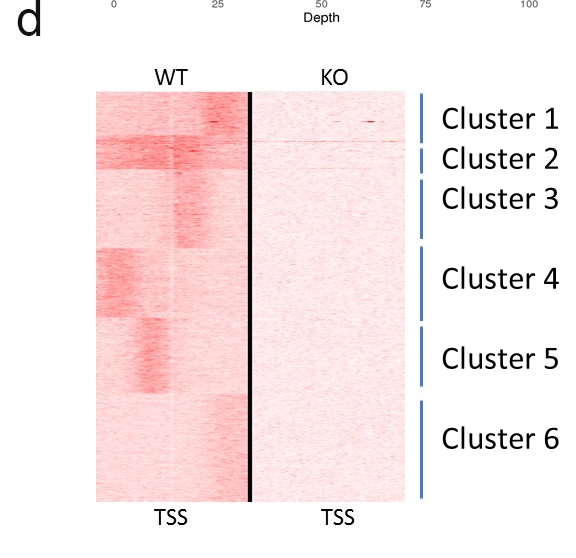
d. Plot of heatmap of reads density. Tag densities from each ChIP-seq dataset were collected within a window of 10?kb around the reference coordinates,
the collected data were subjected to k-means clustering. The major groups and clusters are indicated.
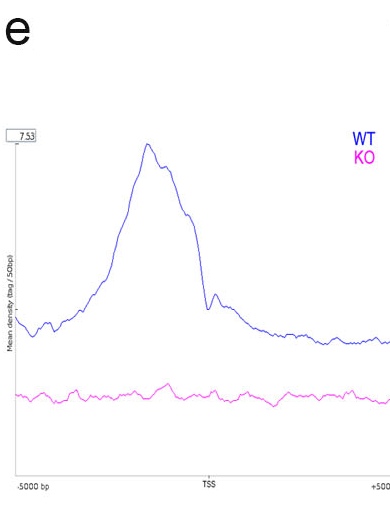
e. Plot of density average profile around TSS. WT showed a significant enrichment in TSS region.
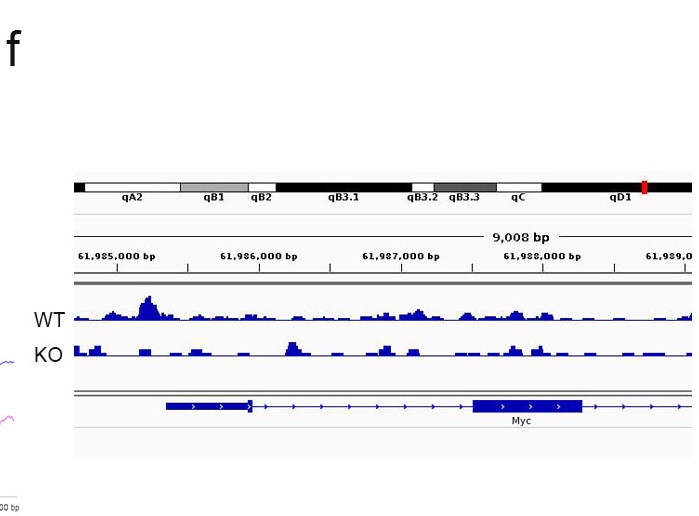
f. Plot of peak of specific gene. WT showed a peak in the promoter of c-myc gene.
TACGenomics is a genomic service company based in California USA, providing comprehensive solution to the problem of handling data generated by NGS devices.